Create and open memory snapshots
Memory snapshots (heap dumps) are useful for identifying memory-related problems. You can analyze the heap to find memory leaks and locate the code that uses large amounts of memory resources. IntelliJ IDEA allows you to analyze .hprof snapshots regardless of whether they were taken in the IDE or any other external tool.
Take a memory snapshot
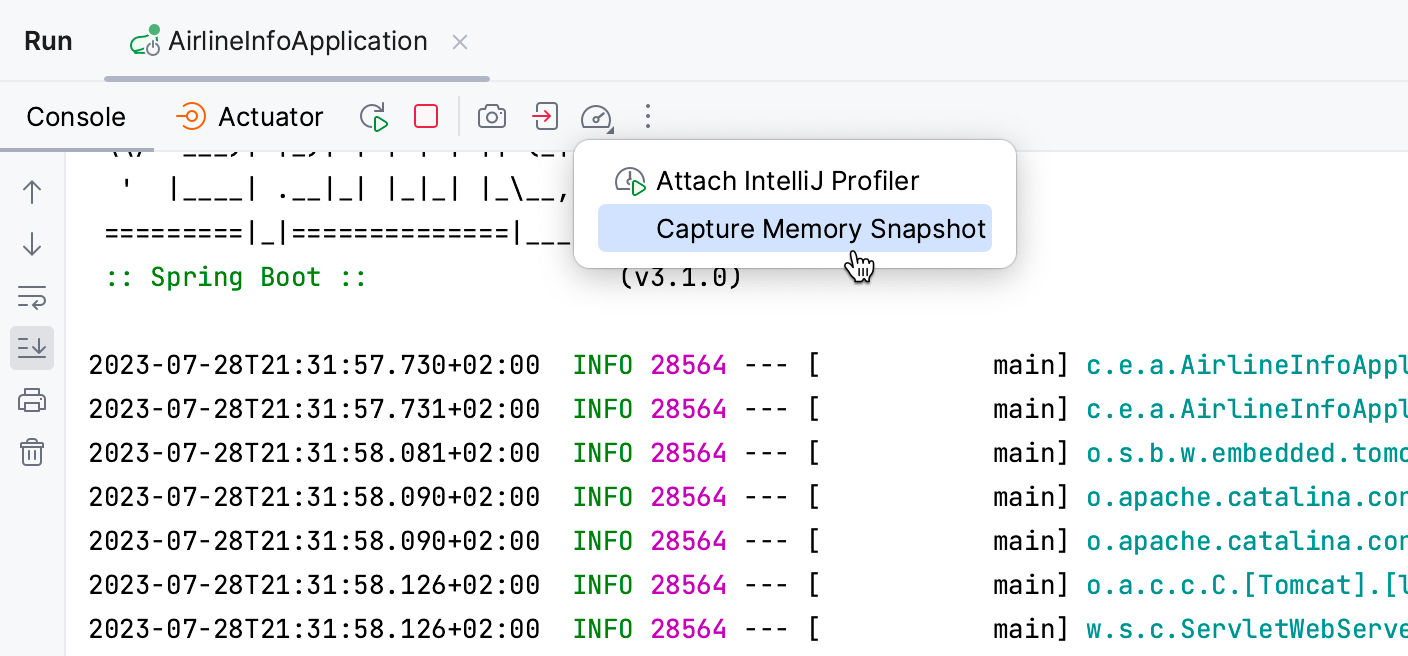
If the process is already running through the Run or Services tool window, click .

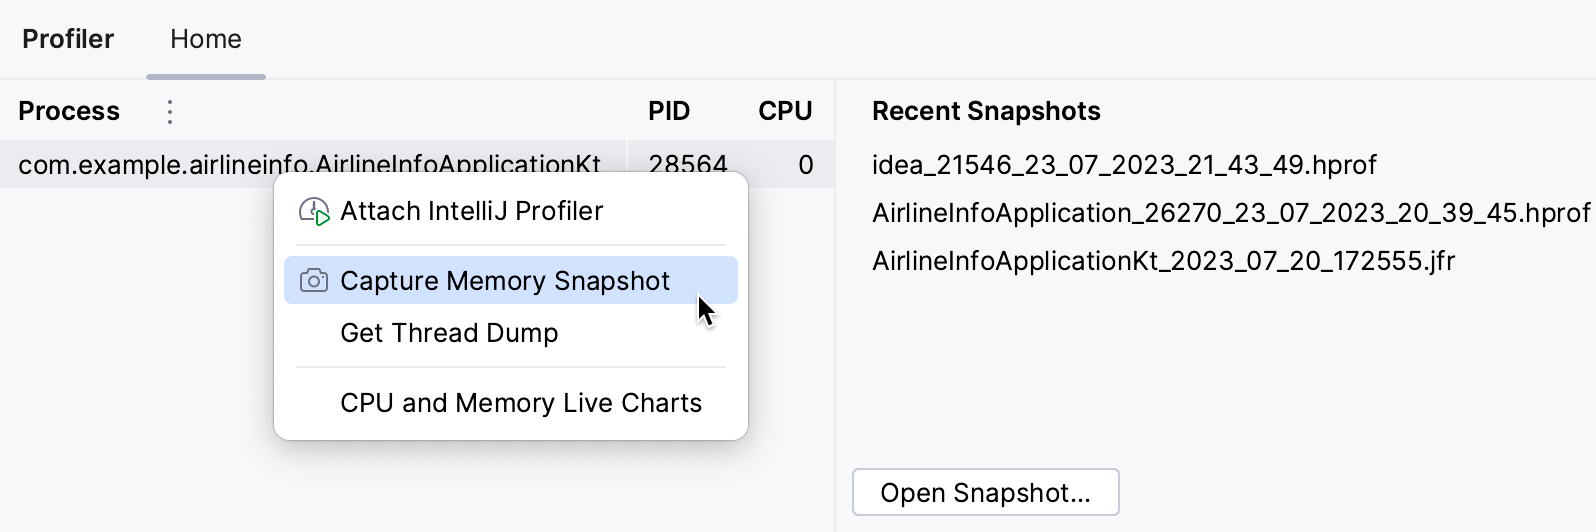
For arbitrary processes: in the Profiler tool window (), right-click the process and select Capture Memory Snapshot.

When the snapshot is captured, it opens for analysis right away.
The snapshot also appears under Recent snapshots. From there, you can view the recent snapshots or open other snapshots that are stored elsewhere on your hard drive.
Open an external memory snapshot
Open the Profiler tool window.
On the Recent Snapshots tab, click Open Snapshot, then select the hprof file that you want to open.
By default, the snapshots are stored in the user home directory. If you prefer another location, you can change that.
Change the snapshots location
Open the Profiler tool window.
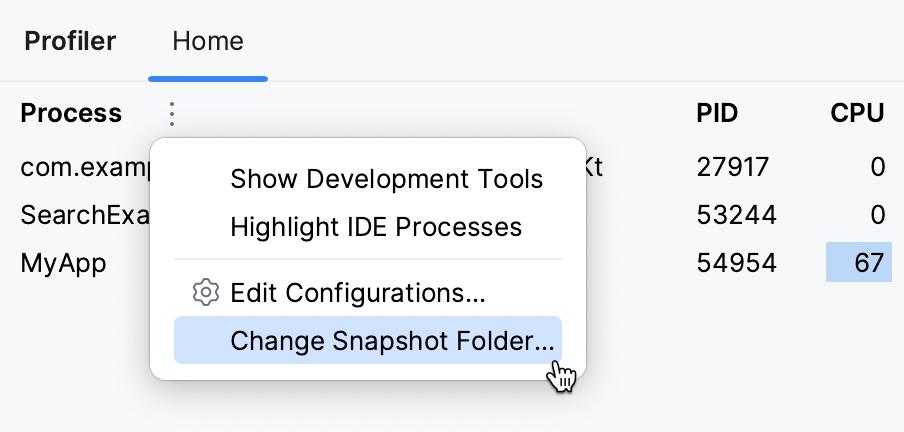
On the Home tab, click More, then select Change Snapshots' Folder.

If you are developing an IDE plugin, you may want to take a memory snapshot of IntelliJ IDEA itself.
Take a memory snapshot of the IDE
In the main menu, go to .