Simultaneous debugging sessions
When building web applications with multiple tiers, you can have frontend PHP code calling into backend PHP code. Often, developers work on both sides of such application at the same time. This tutorial describes several ways to step from front-end code into back-end code and debug them simultaneously.
Before you start debugging, make sure that you have a debugging engine installed and configured properly. PhpStorm supports debugging with two most popular tools: Xdebug and Zend Debugger. These tools cannot be used simultaneously because they block each other. To avoid this problem, you need to update the corresponding sections in the php.ini file as described in Configure Xdebug and Configure Zend Debugger.
Open the active php.ini file in the editor:
In the Settings dialog () , click PHP.
On the PHP page that opens, click
next to the CLI Interpreter field.
In the CLI Interpreters dialog that opens, the Configuration file read-only field shows the path to the active php.ini file. Click Open in Editor.
The way Xdebug and Zend Debugger work is that they make a connection from the PHP interpreter to the IDE. While possible, it's good practice to not do this for every request being made but only for those where debugging is desired. For our frontend script, we'll do this from the browser using the PhpStorm bookmarklets or a Browser Debugging Extension.
Both debugging engines can start a debugging session on-demand by passing in a request variable (XDEBUG_SESSION_START=session_name for Xdebug, start_debug=1 for Zend Debugger), which is what the bookmarklets and browser extensions do. However, this will only work for the first script we hit. Consider the following two scripts: frontend.php and backend.php.
frontend.php:
<?php $personJson = file_get_contents('http://localhost/backend.php'); $person = json_decode($personJson); var_dump($person);backend.php:
<?php
class Person {
    public $Name;
    public $Email;
}

$person = new Person();
$person->Name = "John";
$person->Email = "john.smith@company.com";

echo json_encode($person);
When the first script calls into the second script using file_get_contents, it starts a separate HTTP connection which neither is a part of the existing debugging session, nor starts a new one. If we want Xdebug or Zend Debugger to start debugging for the called script as well, we need to either configure the debugger to start debugging all the time (xdebug.remote_autostart=1 for Xdebug 2 or xdebug.remote_autostart=yes for Xdebug 3), or pass the request parameters along.
Let's rewrite the frontend.php script to do this. In its simplest form, we could check for the Xdebug or Zend Debugger request parameters to be present and just pass them along.
<?php
$debuggingQuerystring = '';
if (isset($_GET['XDEBUG_SESSION_START'])) { // xdebug
    $debuggingQuerystring = 'XDEBUG_SESSION_START=' . $_GET['XDEBUG_SESSION_START'];
}
if (isset($_COOKIE['XDEBUG_SESSION'])) { // xdebug (cookie)
    $debuggingQuerystring = 'XDEBUG_SESSION_START=PHPSTORM';
}
if (isset($_GET['start_debug'])) { // zend debugger
    $debuggingQuerystring = 'start_debug=' . $_GET['start_debug'];
}

$personJson = file_get_contents('http://localhost/backend.php?' . $debuggingQuerystring);
$person = json_decode($personJson);

var_dump($person);
This should start the client debugging session with the same session name as the parent (unless Xdebug was started using cookies, where we fall back to using the default PHPSTORM session name).
By default, PhpStorm accepts a single debugger connection at a time. This is a good thing: imagine making extensive use of AJAX and having a debugging session per AJAX call that comes in! For some scenarios, though, it makes sense to allow more than one connection, for example, for debugging frontend and backend at the same time.
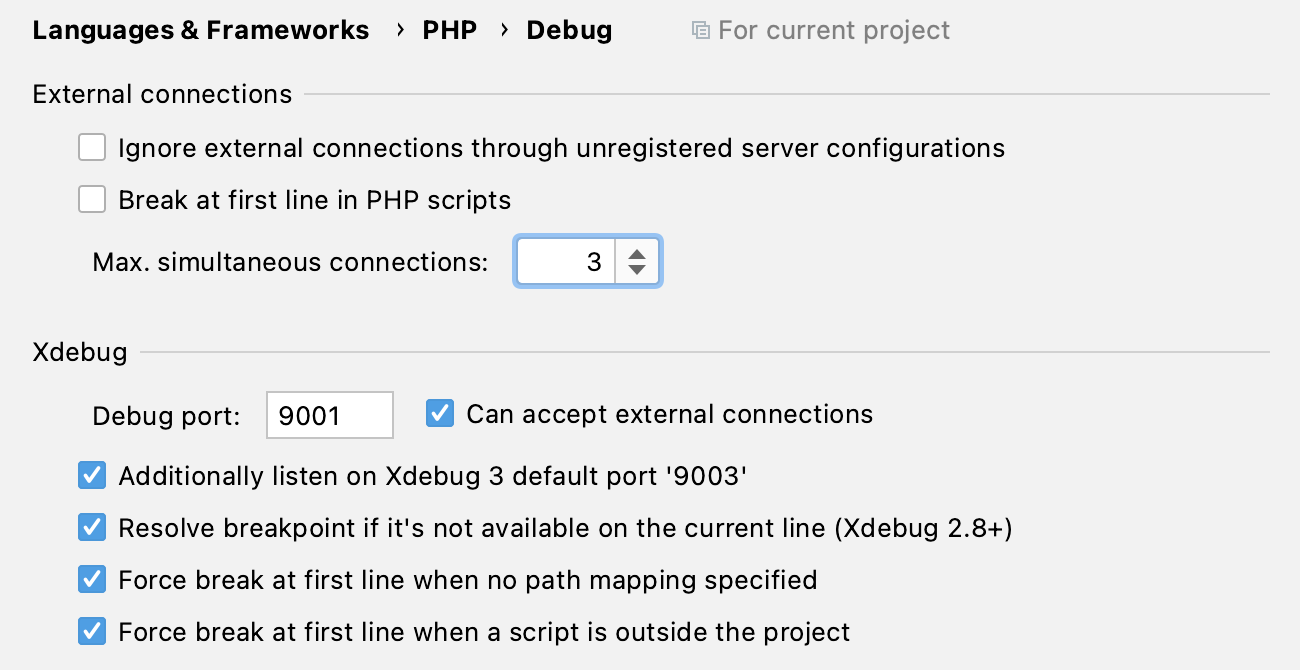
To enable support for several debugger connections, in the Settings dialog () , go to PHP | Debug. On the Debug page that opens, increase the maximum number of connections, for example, to 3.

In PhpStorm, enable listening to incoming debug connections by either clicking (
in the classic UI) on the toolbar/the status bar or selecting Run | Start Listening for PHP Debug Connections in the main menu. This will ensure PhpStorm reacts when a debugging session is started and opens the Debug tool window automatically. Before launching the script, make sure that either a breakpoint is set or the Break at first line in PHP scripts option is enabled on the Debug page of the Settings dialog .
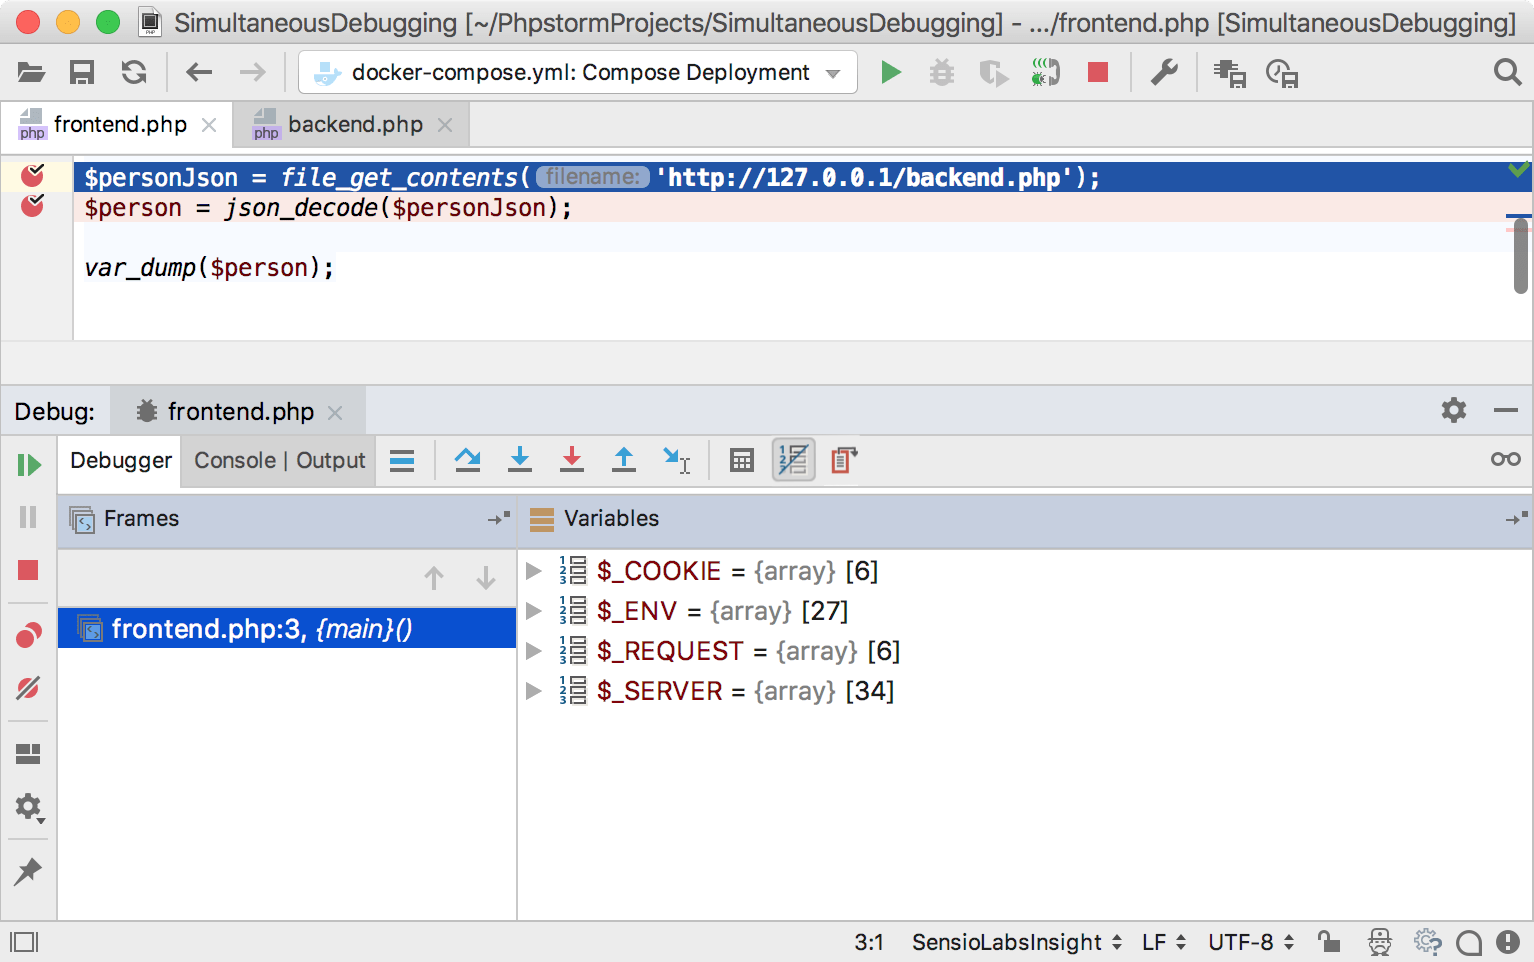
To start a debugging session from the browser, we can use either the PhpStorm bookmarklets or a Browser Debugging Extension. As soon as we add a breakpoint, PhpStorm will notify us that there's an incoming debugger connection and pause script execution.

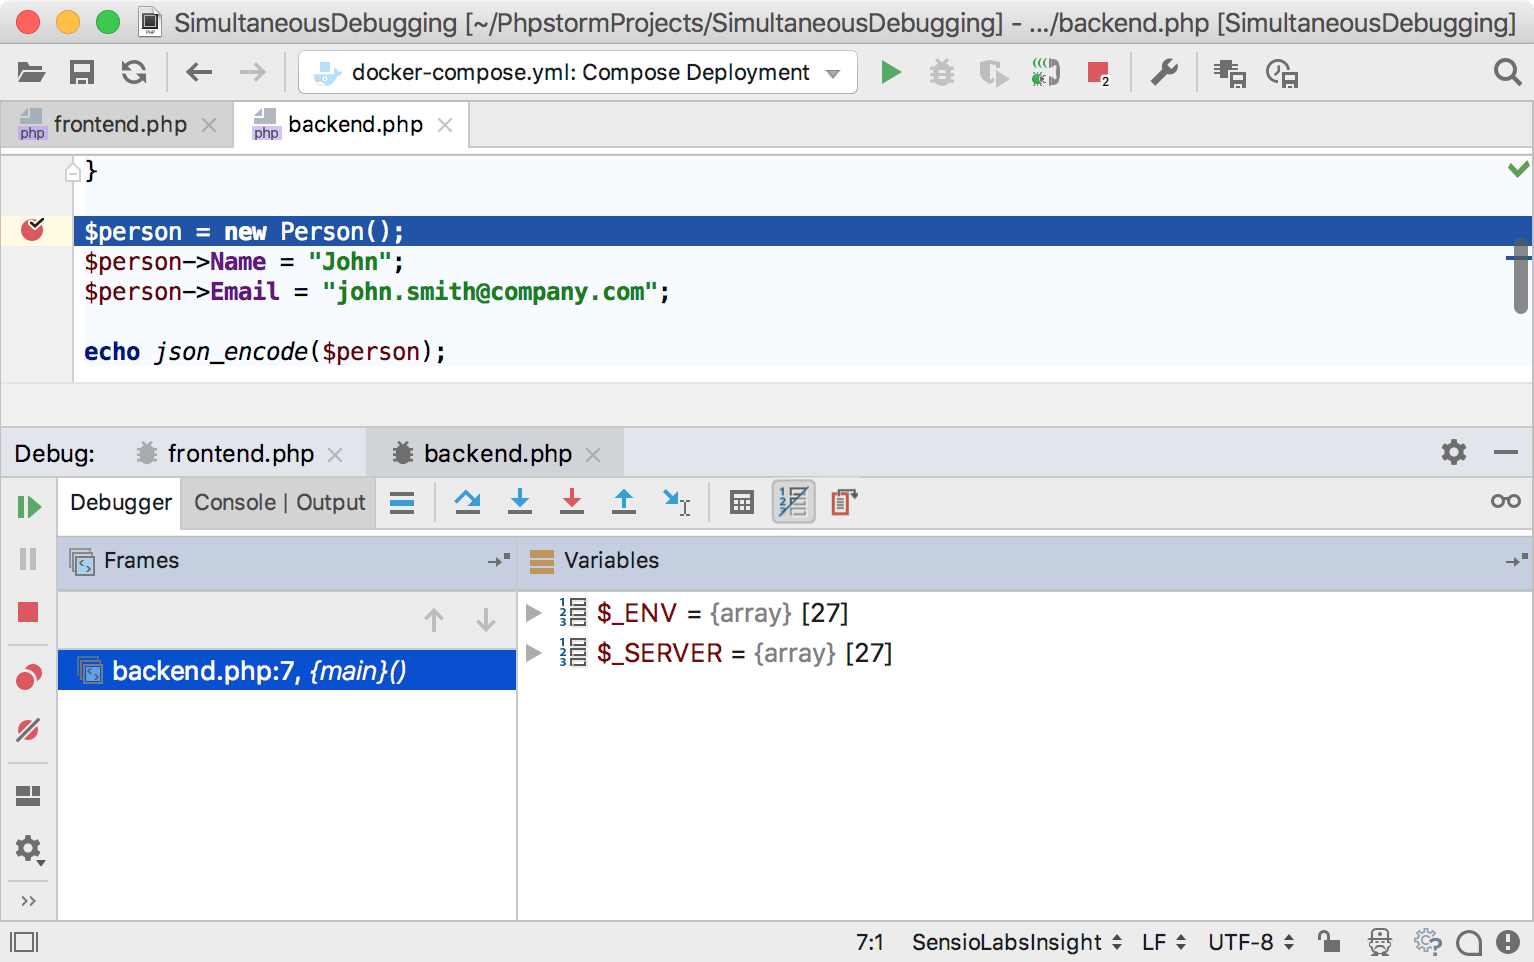
If we step into the file_get_contents function call, PHP will start a second debugger connection, which will in turn open the debugger in PhpStorm in a separate tab. We've now effectively stepped from frontend to backend.

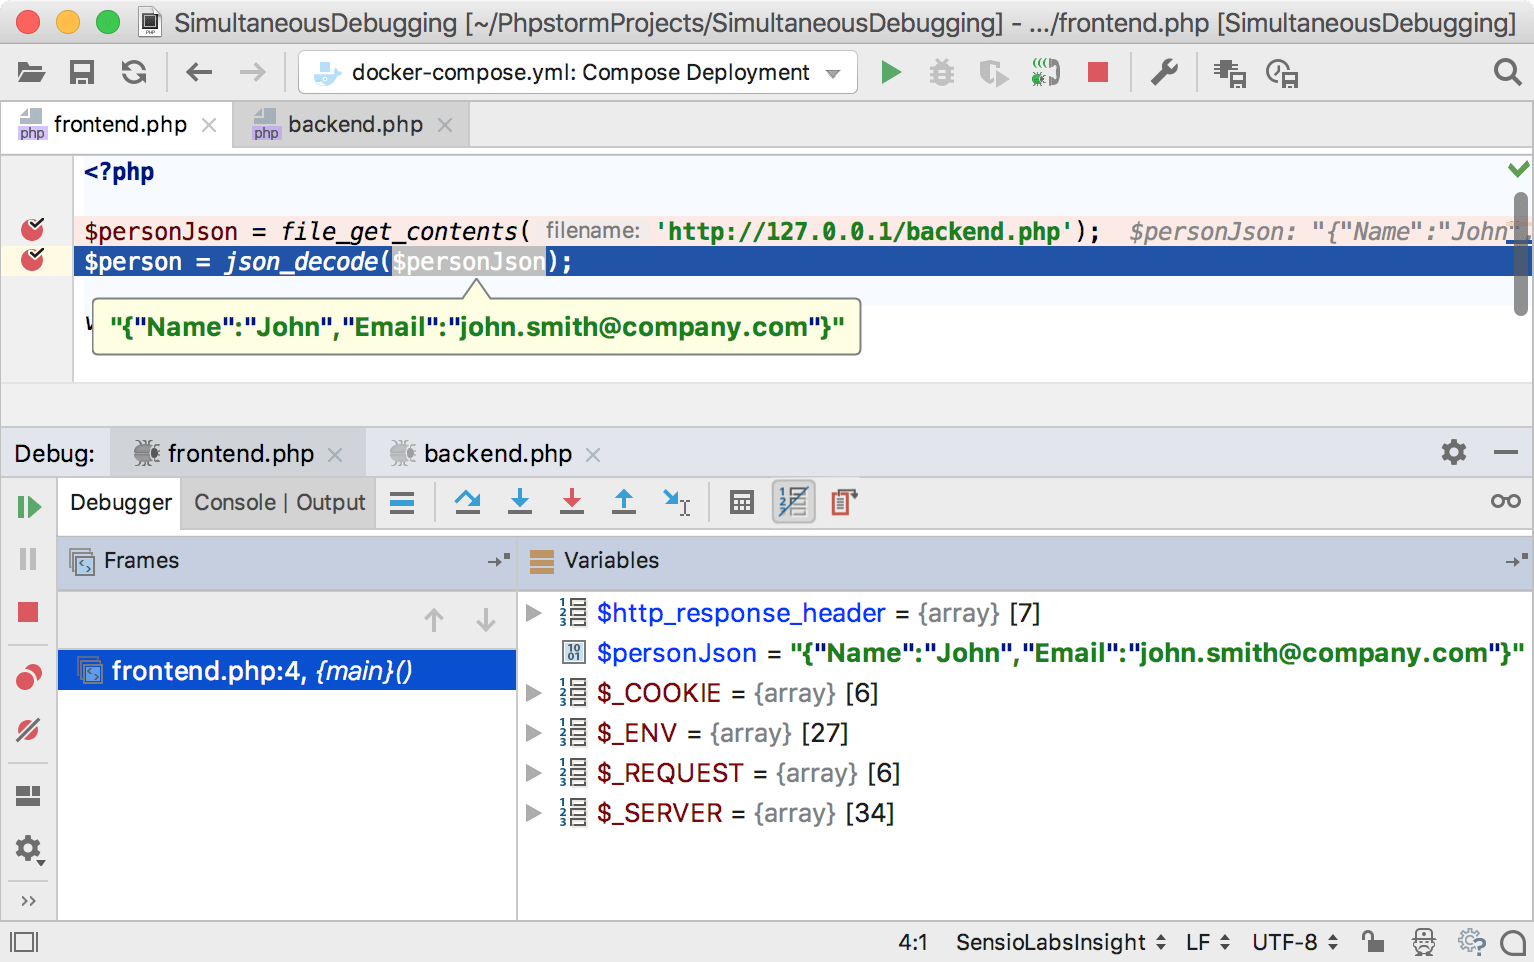
When the backend script returns, the debugger continues where we left off in the frontend script.

Web applications typically consist of both PHP and JavaScript code: PHP code runs on the server side, while JavaScript runs in the browser. With PhpStorm, you can easily debug the PHP code to inspect what is happening on the server, modify variables, and so on. We can also debug the JavaScript running in the browser by starting a JavaScript debugging session from the IDE. To learn how you can debug both parts at the same time, refer to the Debugging PHP and JavaScript code at the same time tutorial.