React
Click Run 'npm install' or Run 'yarn install' in the popup:

You can use npm, Yarn 1, or Yarn 2, refer to npm and Yarn for details.
Alternatively, select Run 'npm install' or Run 'yarn install' from the context menu of package.json in the editor or in the Project tool window .

tip
Projects created from the Welcome screen or via as described in Creating projects are automatically considered trusted.


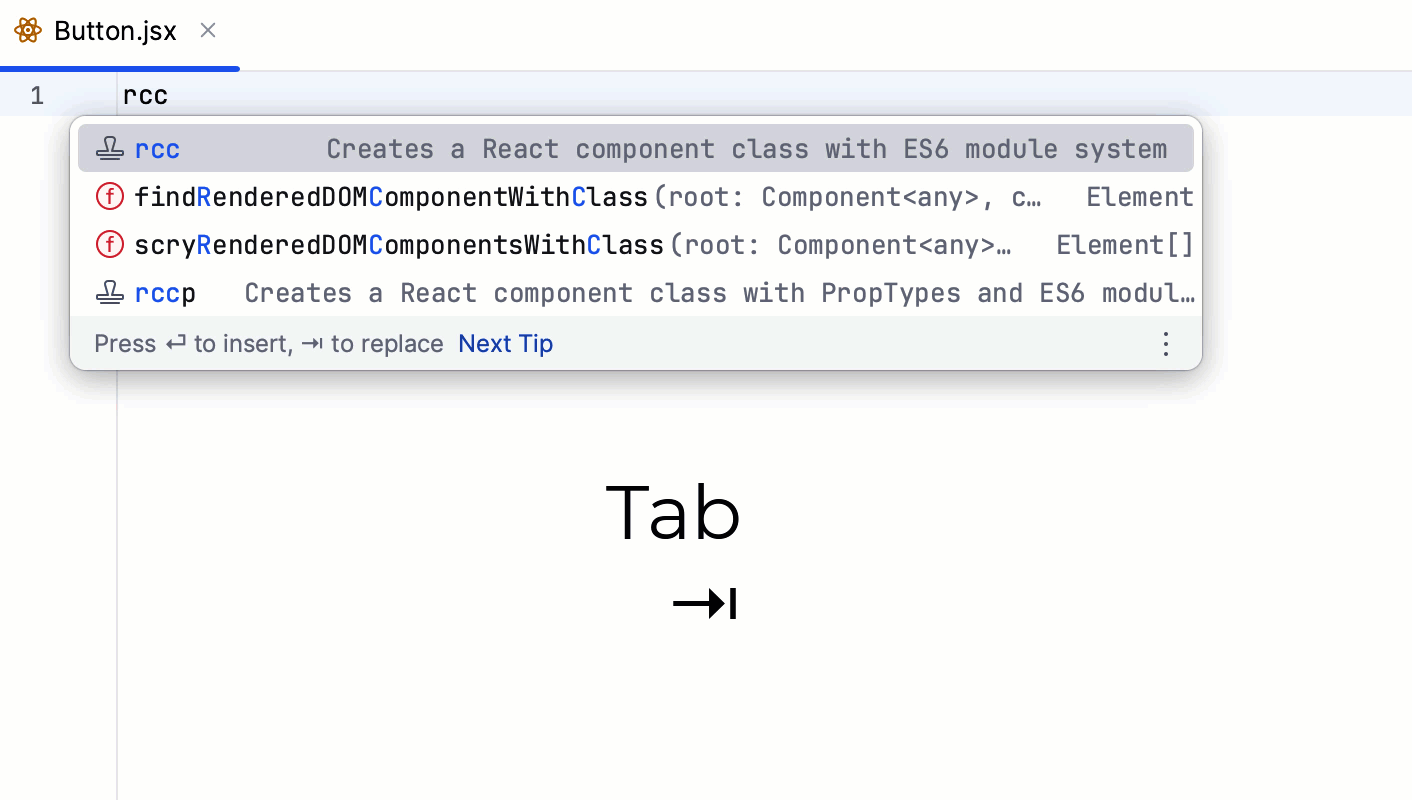
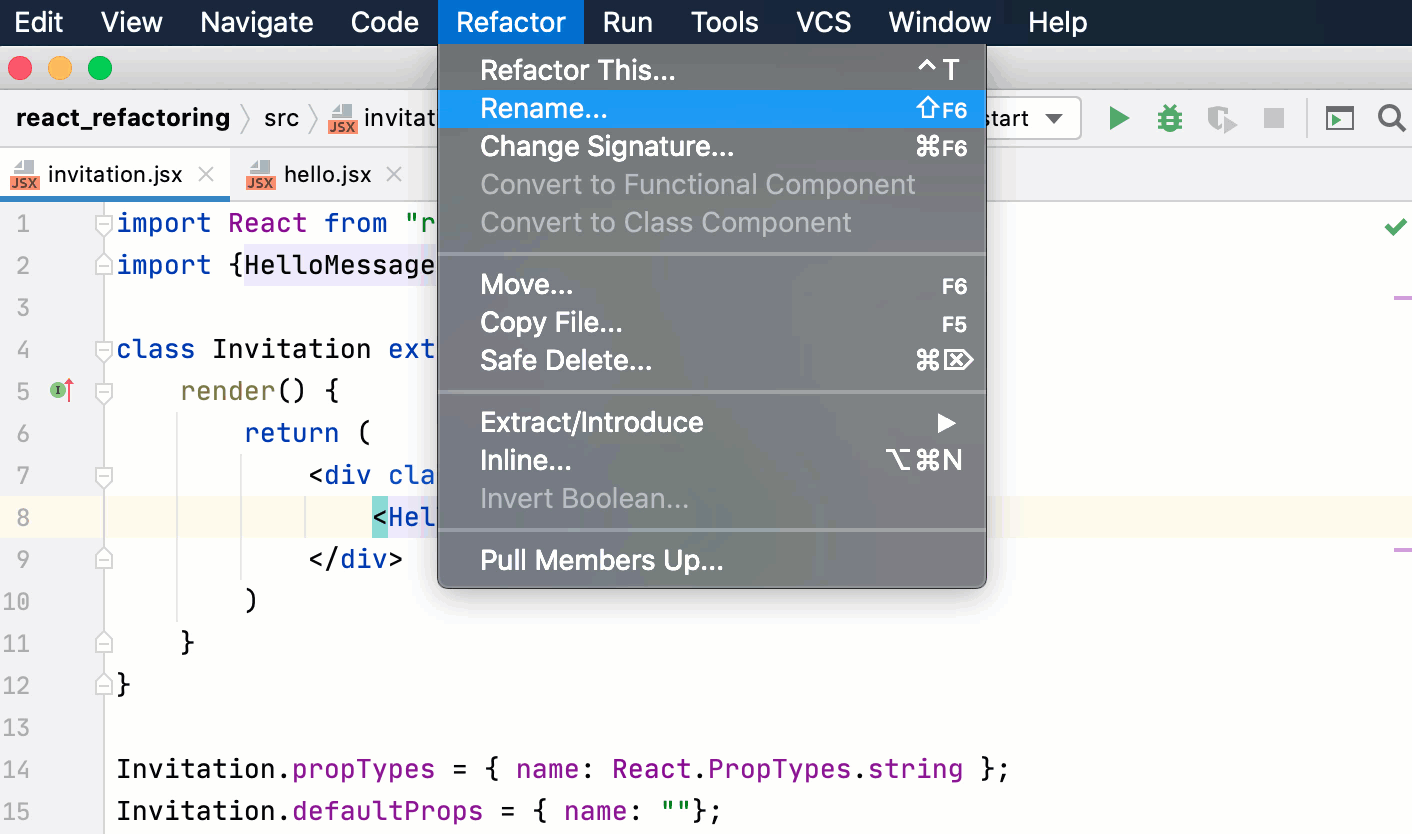
In the Settings dialog () , click Live Templates under Editor, and then expand the React or React hooks node.

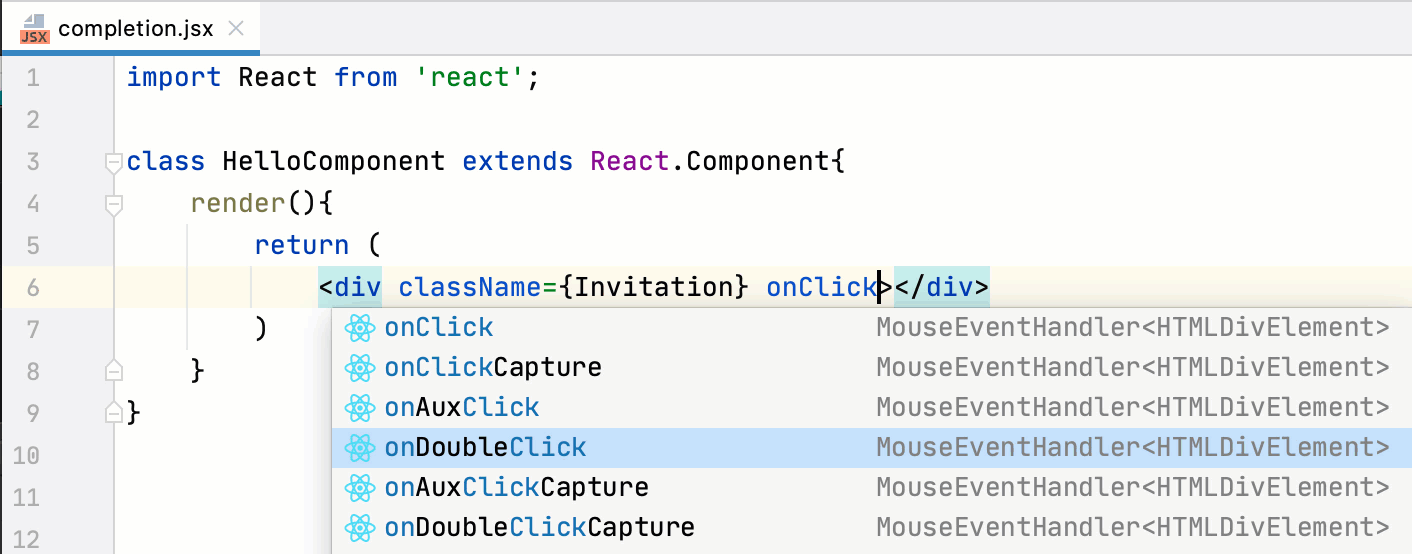
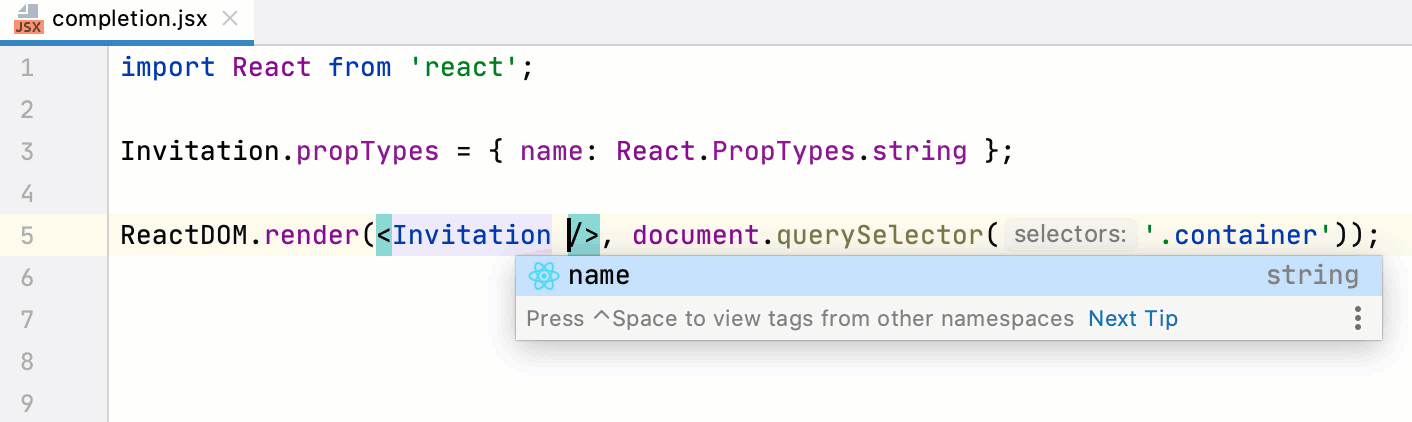
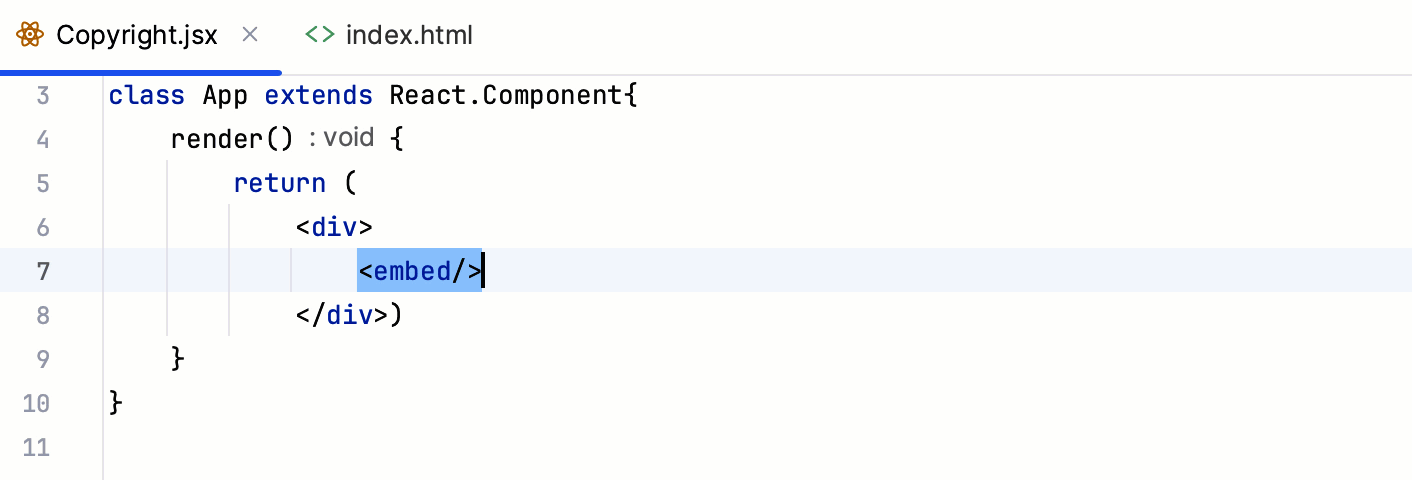
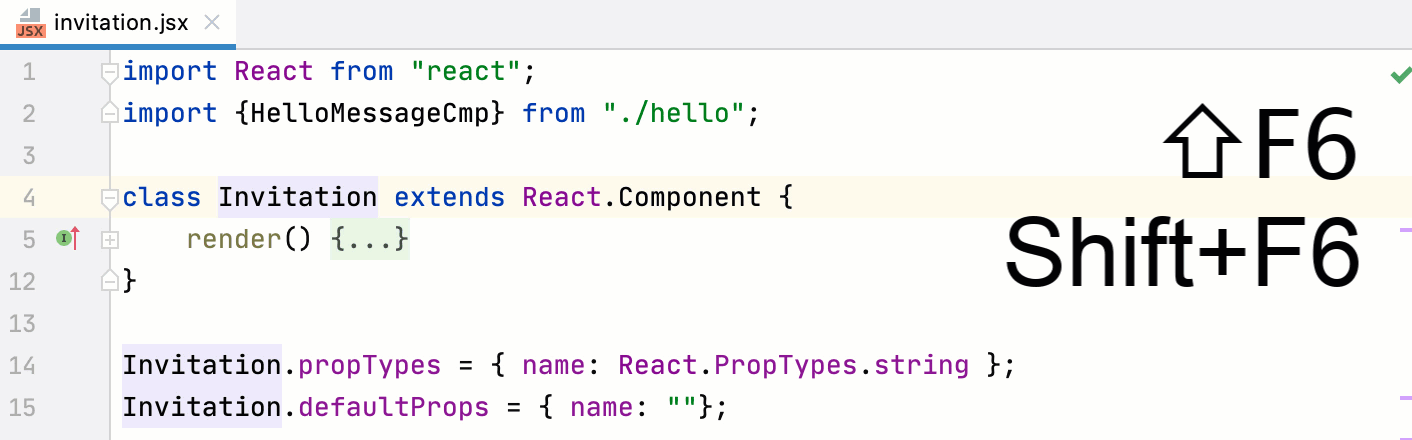
To jump to the declaration of a method or a JavaScript expression inside curly braces
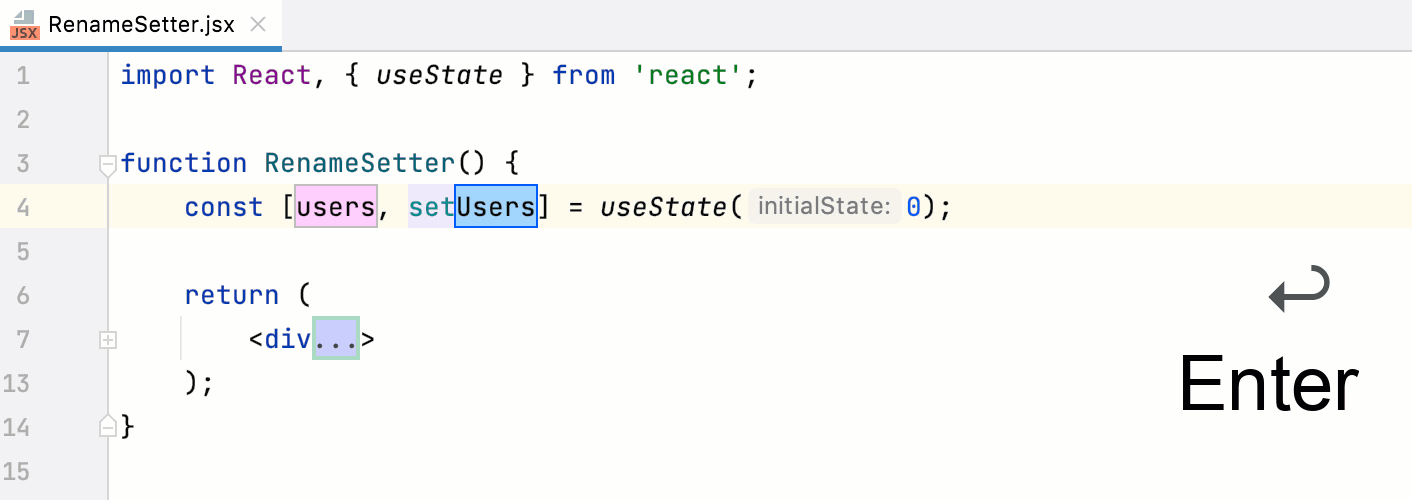
{}, select the method or expression and press .To jump to the declaration of a component, select the component name and press .
tip
Alternatively, use : keeping pressed, hover over the symbol. When the symbol turns into a hyperlink, its declaration will be displayed in the tooltip. Click the hyperlink without releasing the key to open the declaration in the editor. Learn more from Go to declaration and its type.
To view component definition, press . Learn more from Definition and type definition.

To view quick documentation for a component, press . Learn more from JavaScript documentation look-up.


tip
If you created your application with create-vite, your development environment is already preconfigured to use ESLint.
note
Only for applications created with
create-react-app.
Сlick
 in the gutter next to the
 startscript in package.json, or execute thenpm run startcommand in the Terminal , or double-click thestarttask in the npm tool window ().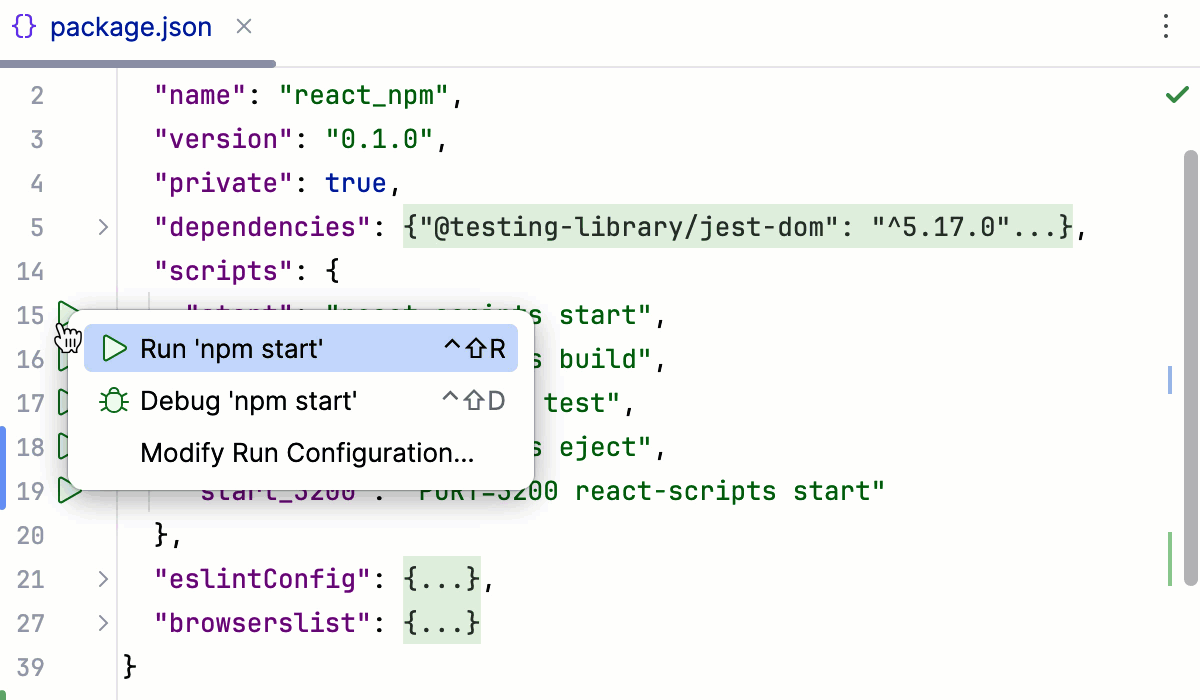 Gif
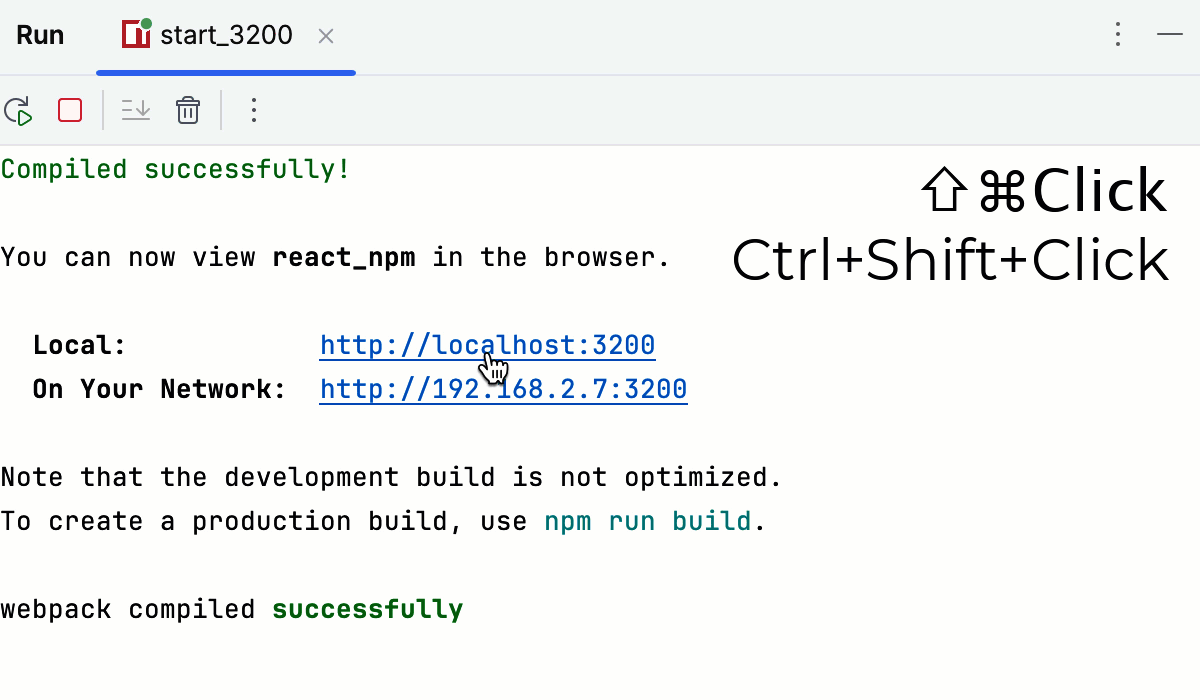
GifWait till the application is compiled and the development server is ready.
The Run tool window or the Terminal shows the URL at which your application is running. If your application was generated with create-react-app, the default URL is http://localhost:3000/. Click this link to view the application.

tip
Thanks to the Webpack Hot Module Replacement, when the development server is running, your application is automatically reloaded as soon as you change any of the source files and save the updates.
Go to . Alternatively, select Edit Configurations from the Run widget on the toolbar.

In the Edit Configurations dialog that opens, click the Add button (
 ) on the toolbar and select npm from the list.
 In the Configuration tab of the Run/Debug Configurations: npm dialog that opens, specify the location of the package.json, the Node.js interpreter, and the package manager to use.
In the Command field, select run from the list and then select the script to run from the Scripts list. Most likely it will be the default
startscript but you can configure another one in your package.json, for example, to run the application on a custom port.
Optionally:
To open the application in the browser, update the configuration as follows: in the Browser / Live Edit tab, select the After launch checkbox, select the browser to open the application in, and specify the URL address at which the application wil run.
If you are going to debug the application, select Google Chrome or another Chromium-based browser.

Select the npm start run configuration from the list on the toolbar and click
 next to it.
Wait till the application is compiled and the development server is ready.
The Run tool window or the Terminal shows the URL at which your application is running. Click this link to view the application.
Alternatively, enable WebStorm to open the application on start as described above.
note
When the development server is running, your application is automatically reloaded as soon as you change any of the source files and save the updates.
note
Debugging of React applications is only supported in Google Chrome and in other Chromium-based browsers.
Set the breakpoints in your code.
Create an npm configuration as described above.
If you generated your application with
create-react-app, WebStorm has already created an npm configuration with the default name npm start. The configuration is available from the Run widget and in the Run/Debug Configurations dialog.In the Configuration tab of the Run/Debug Configurations: npm dialog that opens, specify the location of the package.json, the Node.js interpreter, and the package manager to use.
In the Command field, select run from the list and then select the script to run from the Scripts list. Most likely it will be the default
startscript but you can configure another one in your package.json, for example, to run the application on a custom port.In the Browser / Live Edit tab, select the After launch checkbox, select Google Chrome or another Chromium-based browser from the list, select the with JavaScript debugger checkbox, and then specify the URL at which your application will run.

Click Run.
To re-run the configuration, select it from the list in the Run widget and click
next to it.WebStorm runs the application in the development mode and at the same time launches a debugging session.

When the first breakpoint is hit, switch to the Debug tool window and proceed as usual: step through the program, stop and resume program execution, examine it when suspended, explore the call stack and variables, set watches, evaluate variables, view actual HTML DOM, and so on.
Set the breakpoints in your code.
Start the application in the development mode as described above and wait till the application is compiled and the development server is ready.
The Run tool window or the Terminal shows the URL at which your application is running. Copy this URL to specify it later in the JavaScript Debug configuration.

Create a JavaScript Debug configuration. To do that, go to in the main menu, click
, and select Javascript Debug from the list.In the Run/Debug Configurations: JavaScript Debug dialog that opens, specify the name of the configuration and the URL address at which the application is running in the development mode. You can copy this URL in the Run tool window or in the Terminal, as described above.

Click Debug.
To re-run the configuration, select it from the list in the Run widget and click
 next to it.
When the first breakpoint is hit, switch to the Debug tool window and proceed as usual: step through the program, stop and resume program execution, examine it when suspended, explore the call stack and variables, set watches, evaluate variables, view actual HTML DOM, and so on.
Set the breakpoints in your code.
Start the application in the development mode as described above and wait till the application is compiled and the development server is ready.
The Run tool window or the Terminal shows the URL at which your application is running. Hold and click this URL link. WebStorm starts a debugging session with an automatically generated configuration of the type JavaScript Debug.
 Gif
GifIf you launched your application in the development mode from the New Terminal, you can just click the Start debugging in browser button next to the link.

note
The button is not available from the New Terminal in the WSL.
Click
or  in the gutter and select Run <test_name> from the list.
  Gif
GifYou can also see whether a test has passed or failed right in the editor, thanks to the test status icons
 and
and  in the gutter.
tip
To run all tests in a file, select this file in the Project tool window , and then select Run '<filename>' from its context menu.
Open the Run/Debug Configuration dialog ( in the main menu), click
in the left-hand pane, and select Jest from the list. The Run/Debug Configuration: Jest dialog opens.tip
Alternatively, select a test file in the Project tool window and select Create <filename> from the context menu.
Specify the Node interpreter to use and the working directory of the application. By default, the Working directory field shows the project root folder. To change this predefined setting, specify the path to the desired folder.
In the Jest package field, specify the path to the react-scripts package.
In the Jest options field, type
--env=jsdom.
Select the Jest run/debug configuration from the list of configurations and click
 in the list or on the toolbar.
Monitor test execution and analyze test results in the Test Runner tab of the Run tool window. For more information, refer to Explore test results.
Select the Jest run/debug configuration from the list on the main toolbar and click
to the right.In the Debug tool window that opens, proceed as usual: step through the program, stop and resume program execution, examine it when suspended, explore the call stack and variables, set watches, evaluate variables, view actual HTML DOM, and so on.
