Dashboard
Last modified: 30 January 2025Path in the Web UI: Home page
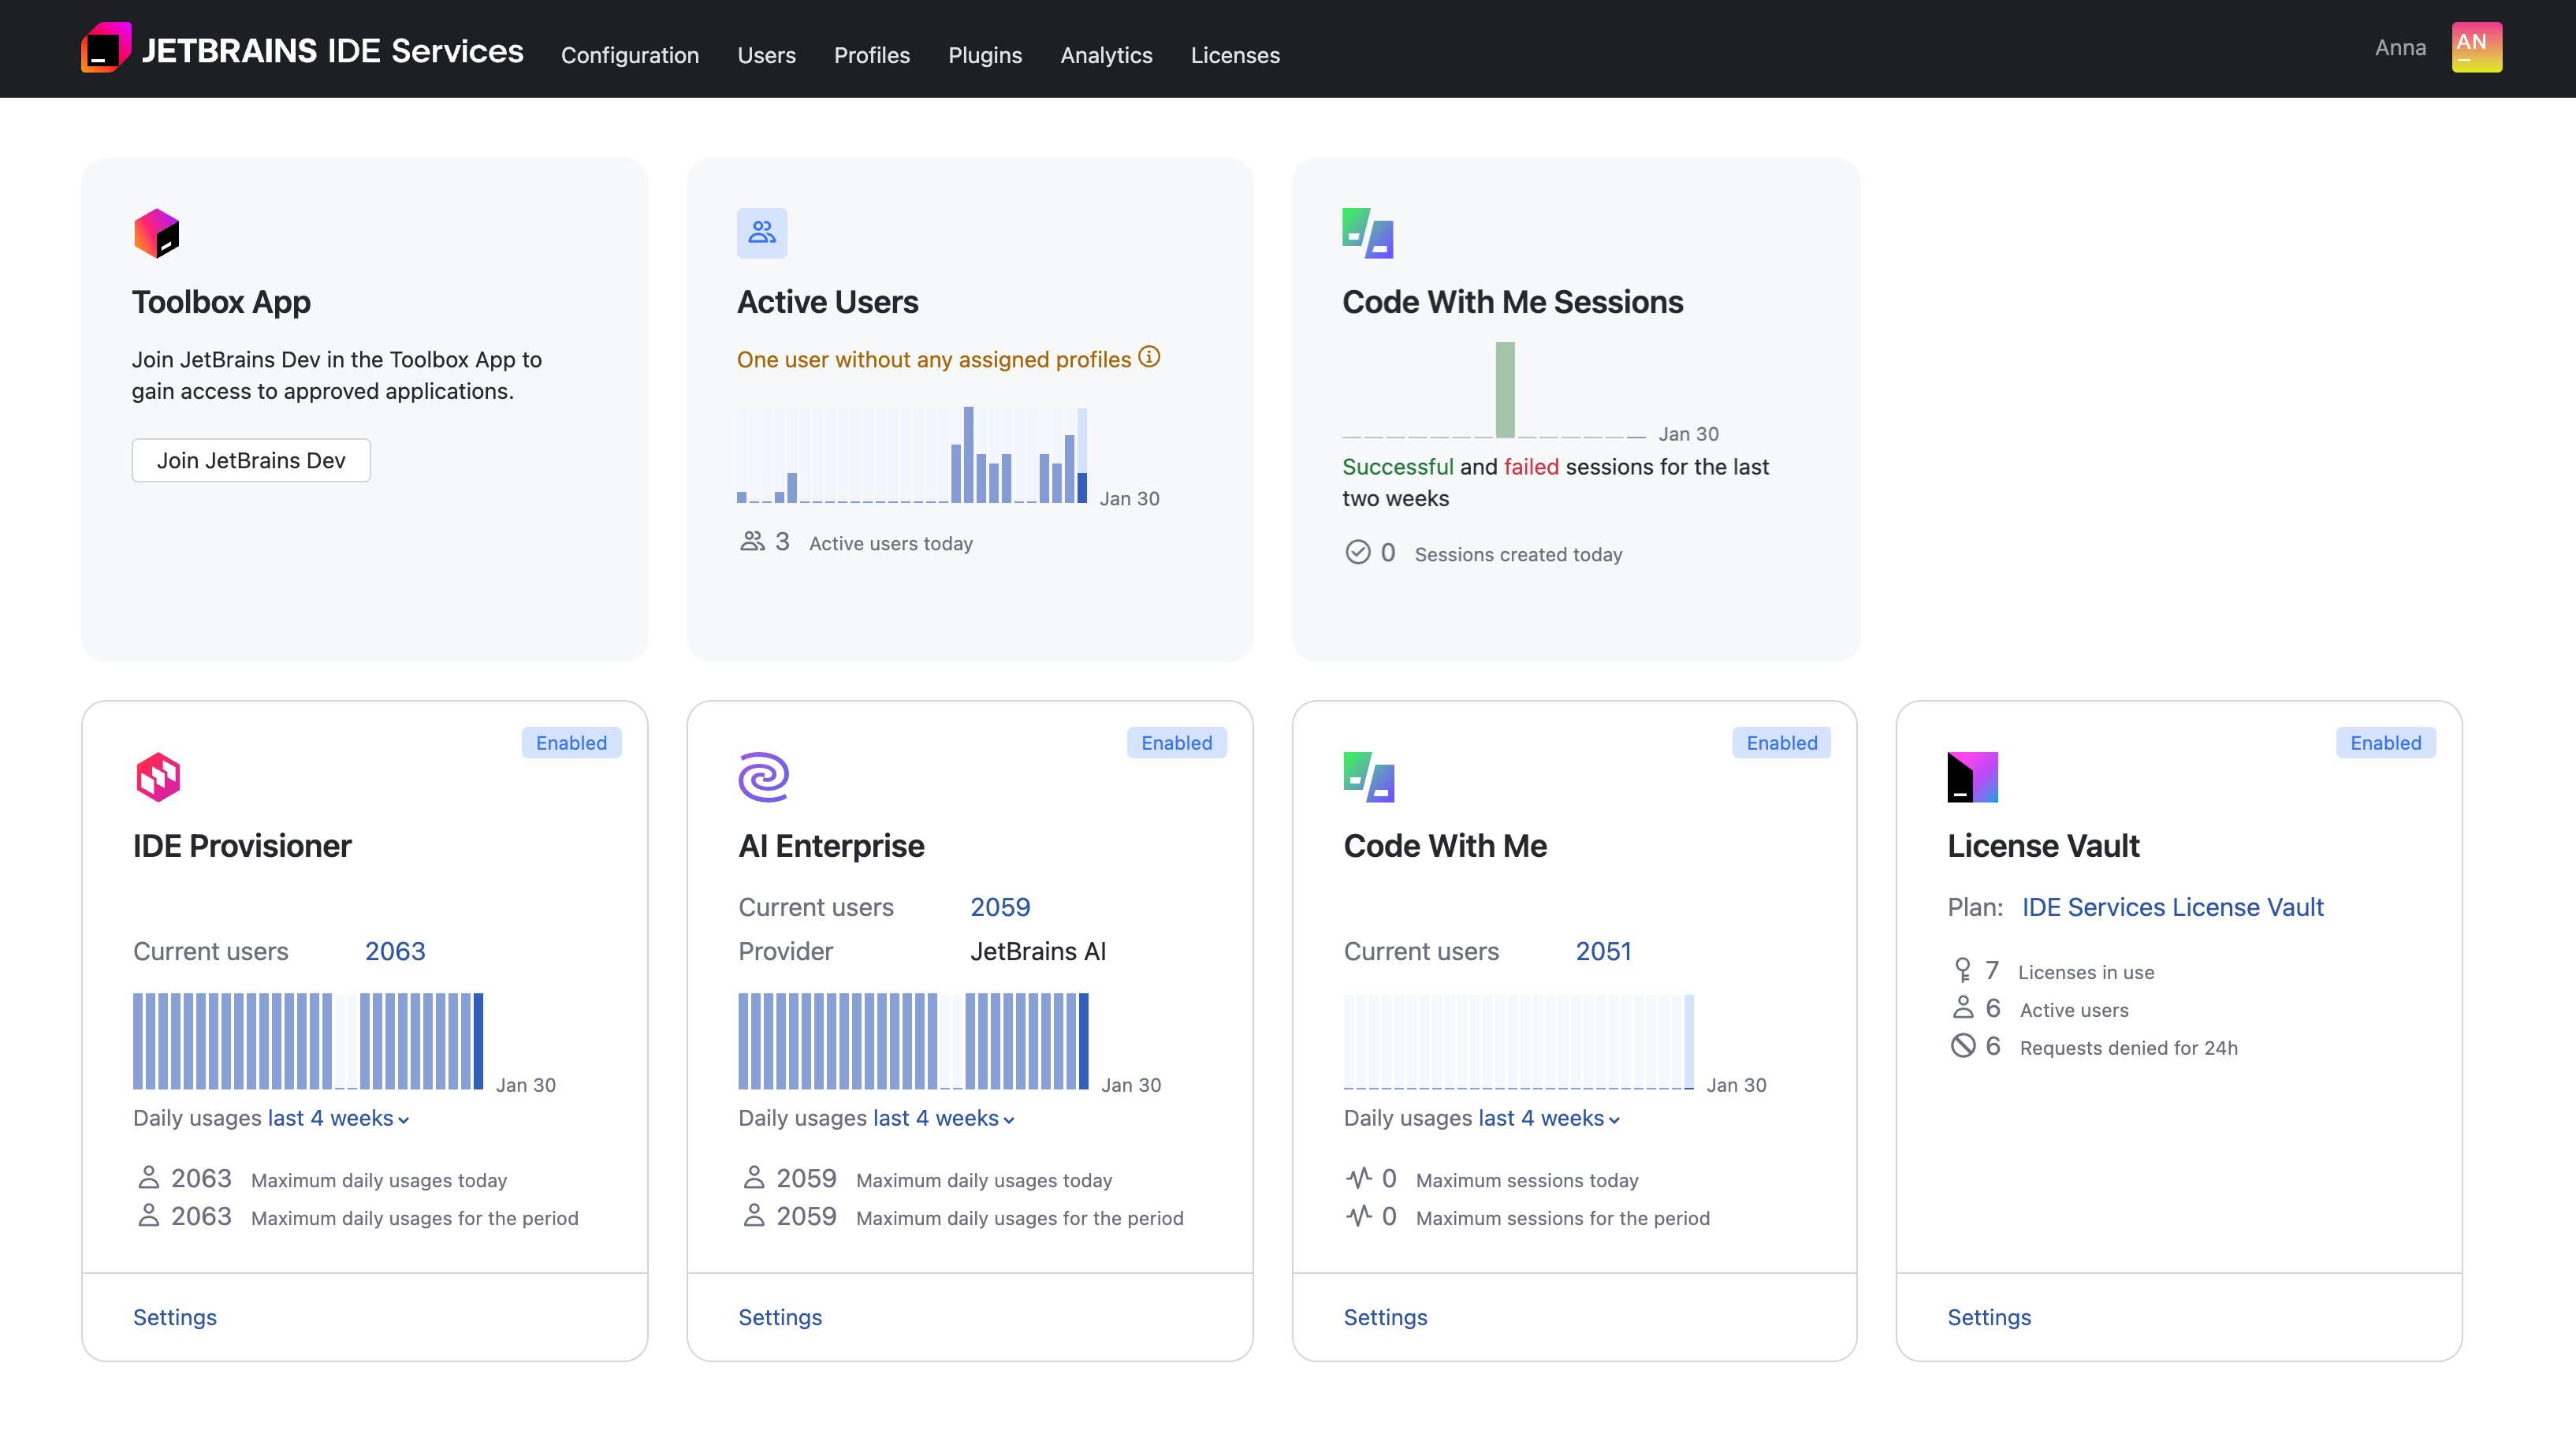
The IDE Services dashboard offers a centralized view over the IDE Services products and their usage within your organization. It also conveniently provides easy access to resources, like the Toolbox App installation and join links or profiles.
The dashboard is on the main page of the Web UI, accessible right after logging in or by clicking the JetBrains IDE Services logo in the top left corner of the screen.
Widgets
The dashboard consists of two sections with widgets – Your Organization and Products.
Your Organization

Toolbox App: allows you to download the latest build of the Toolbox App and provides a link to join your organization.
Active Users: displays the daily number of unique active users that joined your organization and logged in to IDE Services.
Additionally, the widget displays the number of users that have no profiles assigned.
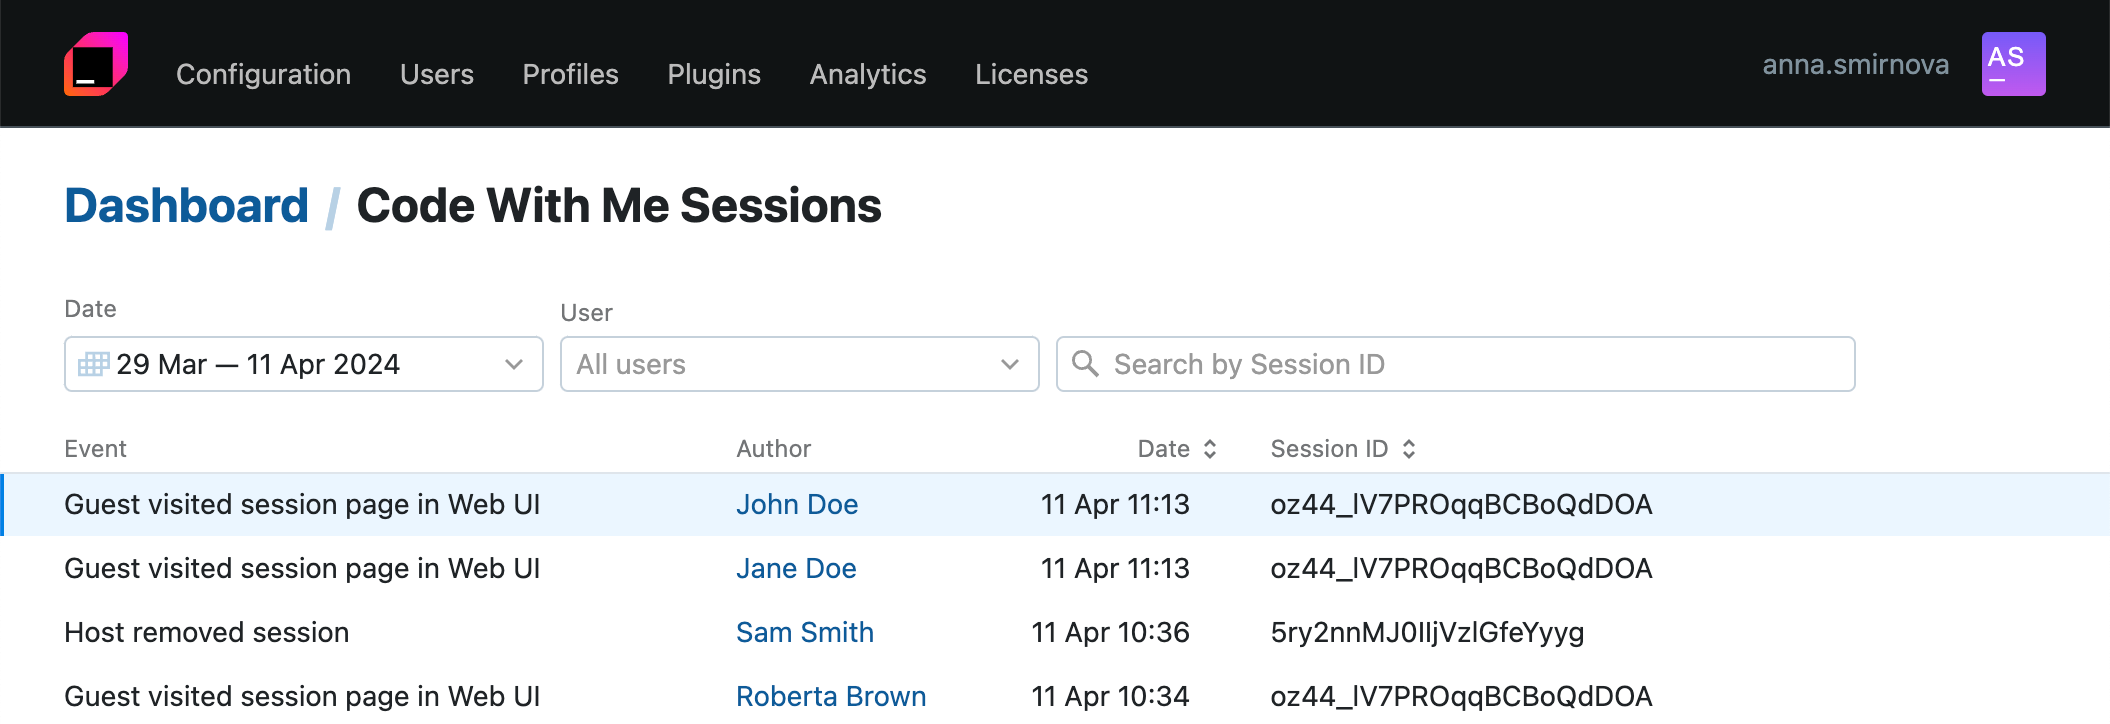
Code With Me Sessions: displays a diagram and number of successful and failed Code With Me sessions for the last two weeks.
Clicking the widget header opens the log of Code With Me sessions. From there, you can learn more about the session events, including error details for failed sessions.

Products
This section contains widgets that help you quickly enable and configure IDE Services products, monitor their state, and track their consumption.

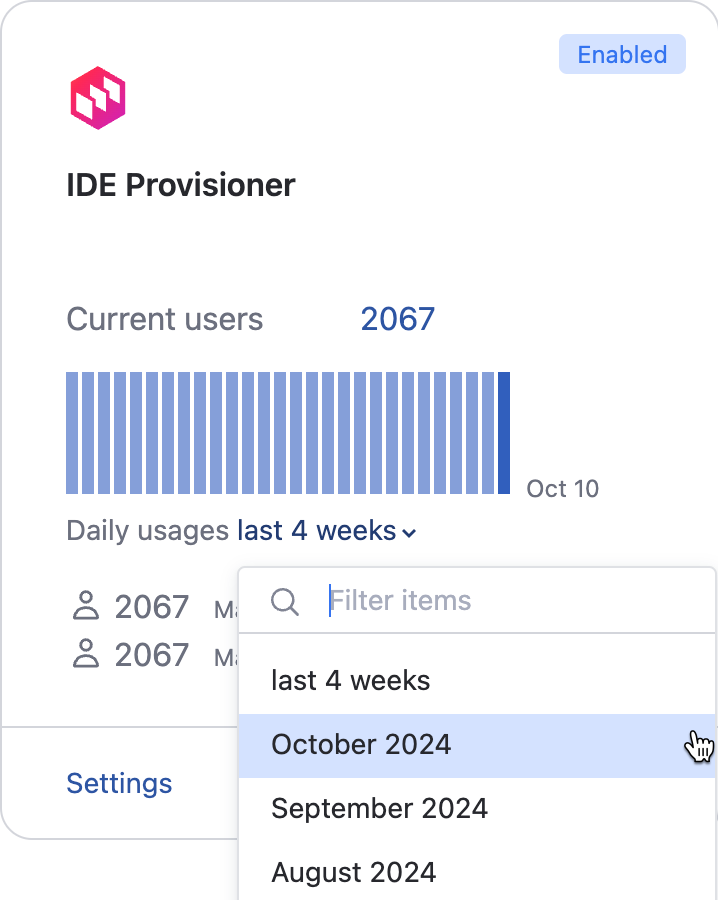
IDE Provisioner: displays the consumption details of IDE Provisioner in your organization. You can check the current number of IDE Provisioner users, the maximum number of users for today or for a particular period.
By default, the widget shows the statistics for the past 4 weeks. You can select another period using the dropdown.

AI Enterprise: displays the consumption details of AI Enterprise in your organization. You can check the current number of AI Enterprise users, the maximum number of users for today or for a particular period.
Code With Me: displays the consumption details of Code With Me Enterprise in your organization. You can check the maximum number of concurrent sessions for today or for a particular period.
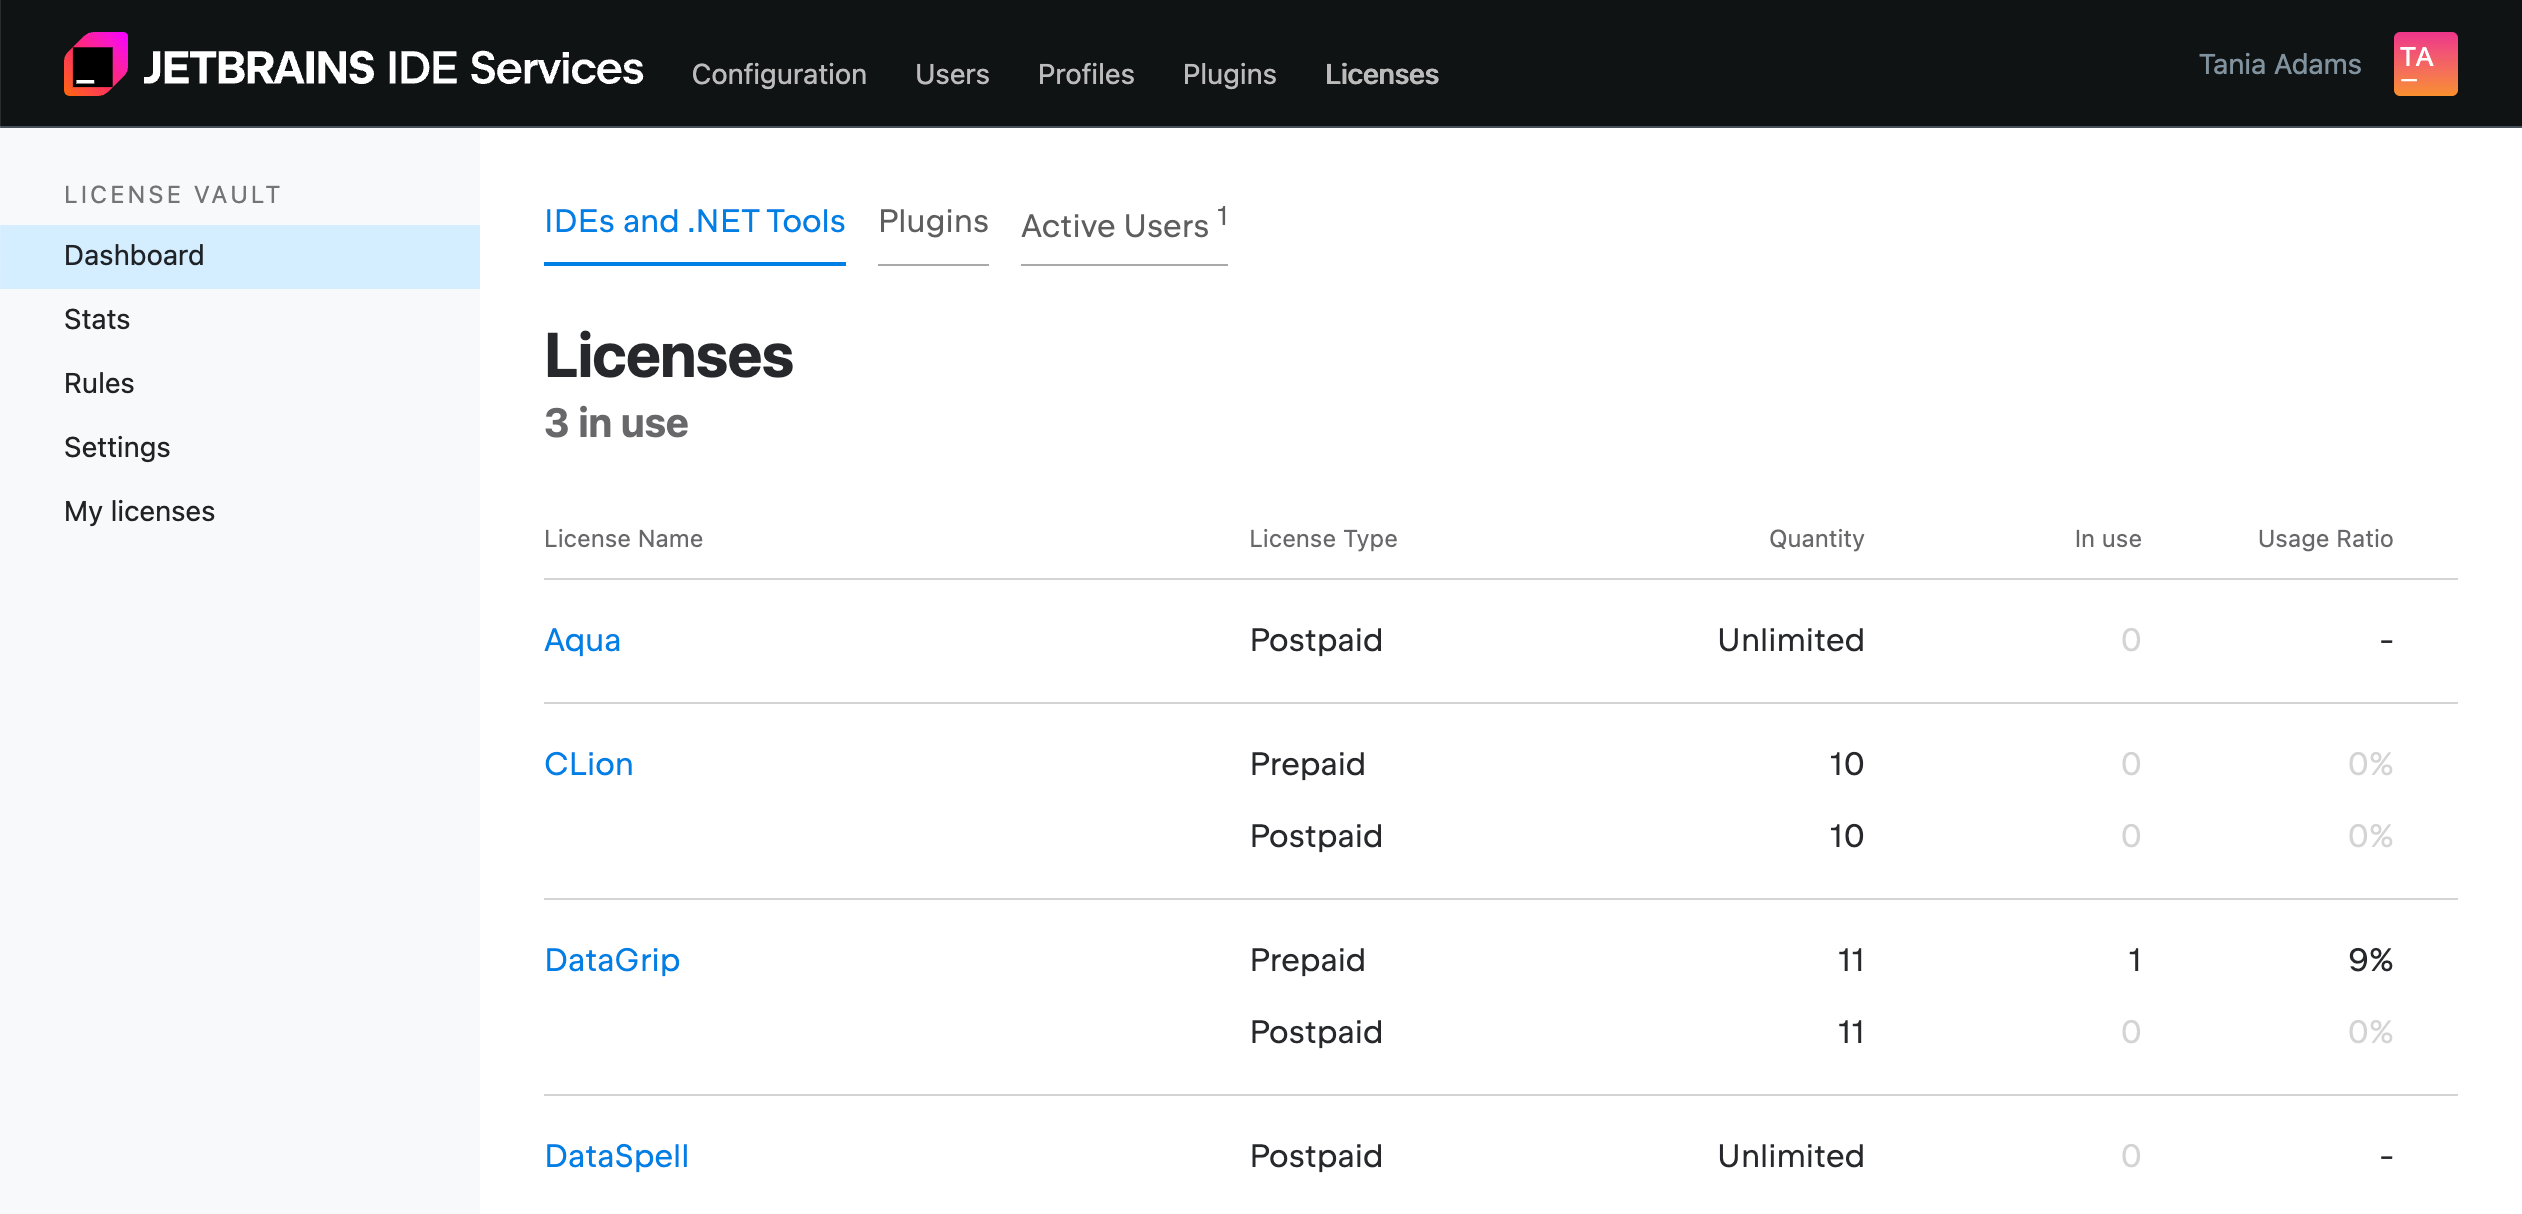
License Vault: displays the total number of licenses purchased in your organization, your current plan, licenses in use, active license users, and denied requests for the last 24 hours.
Using the widget, you can navigate to the Licenses page and learn more about your current plan.

Thanks for your feedback!