Parallel stacks view
Multithreaded applications are always harder to debug as you have to track multiple threads at the same time. In this case, the thread call stack information for all the threads can be helpful. The Parallel Stacks pane lets you observe all threads in your application and quickly navigate between them and their stack frames.
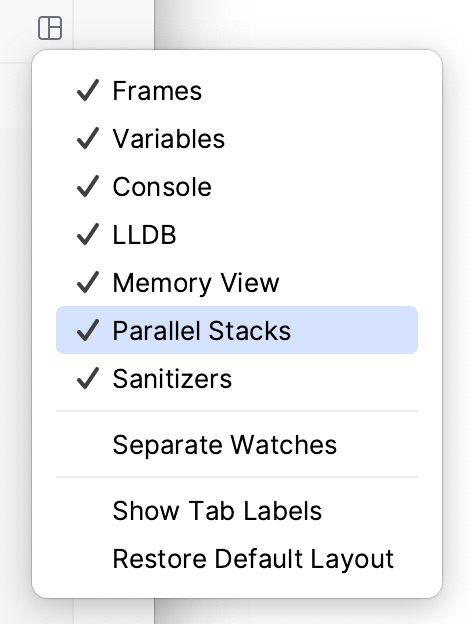
To open the Parallel Stacks view, click in the Debug tool window and select Parallel Stacks:

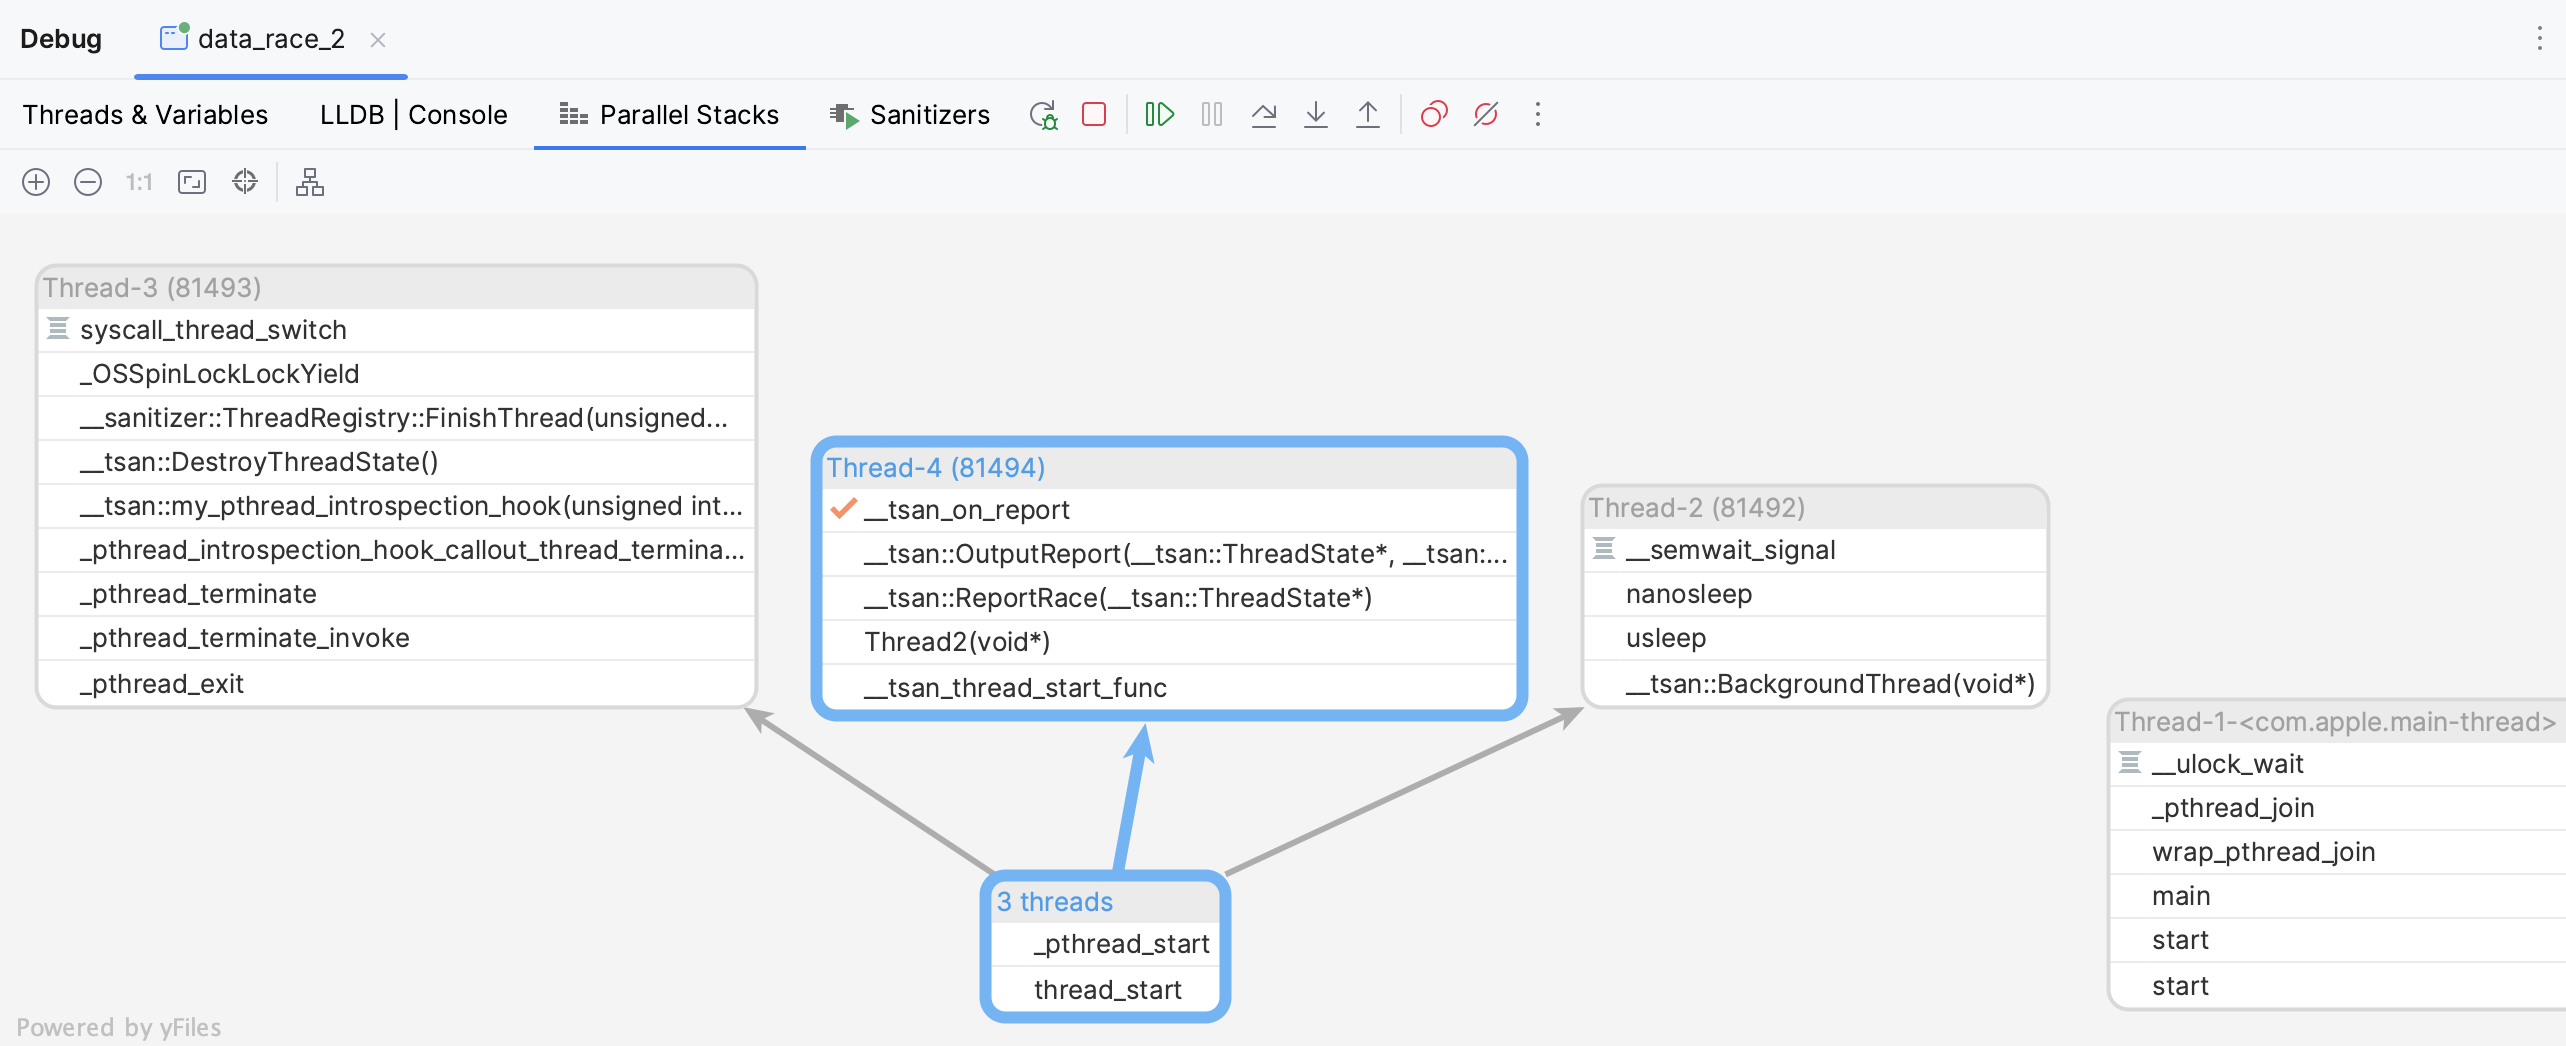
The Parallel Stacks view lets you quickly look at all the threads in your application, and check the call paths and execution points of all running threads. The call path of the current thread is highlighted blue.

Thanks for your feedback!
Was this page helpful?